A selection of interactive Power BI dashboards — turning raw business data into clear, at-a-glance views of what's happening and why.
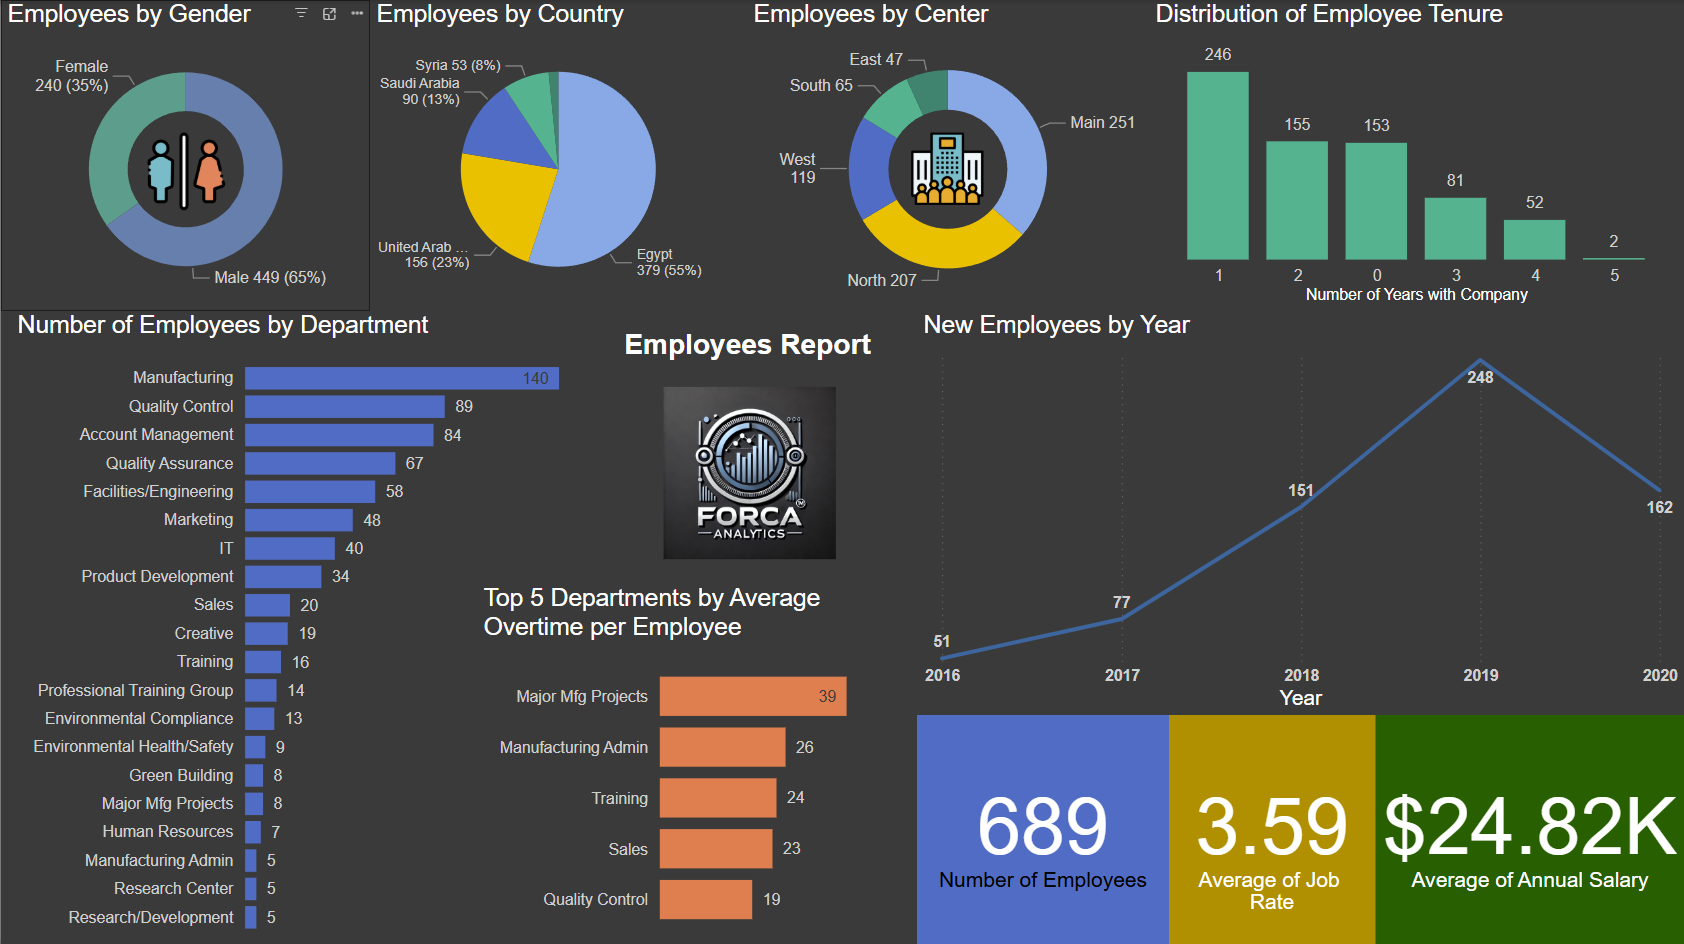
Employee Dashboard
Remote employees broken down by country, gender, center, salary, and department.
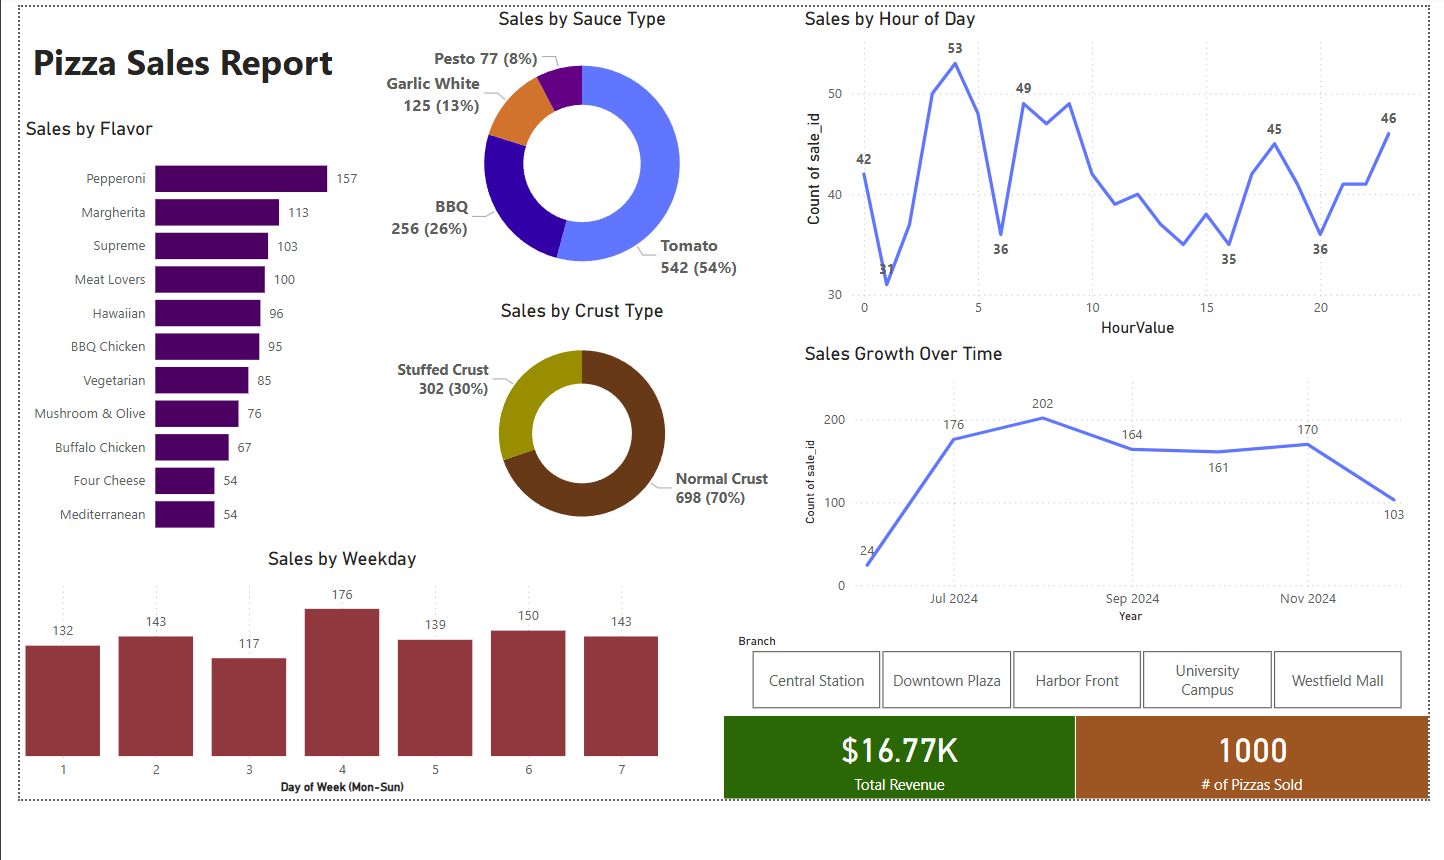
Pizza Sales Dashboard
Pizza sales analysis — down to the crust.
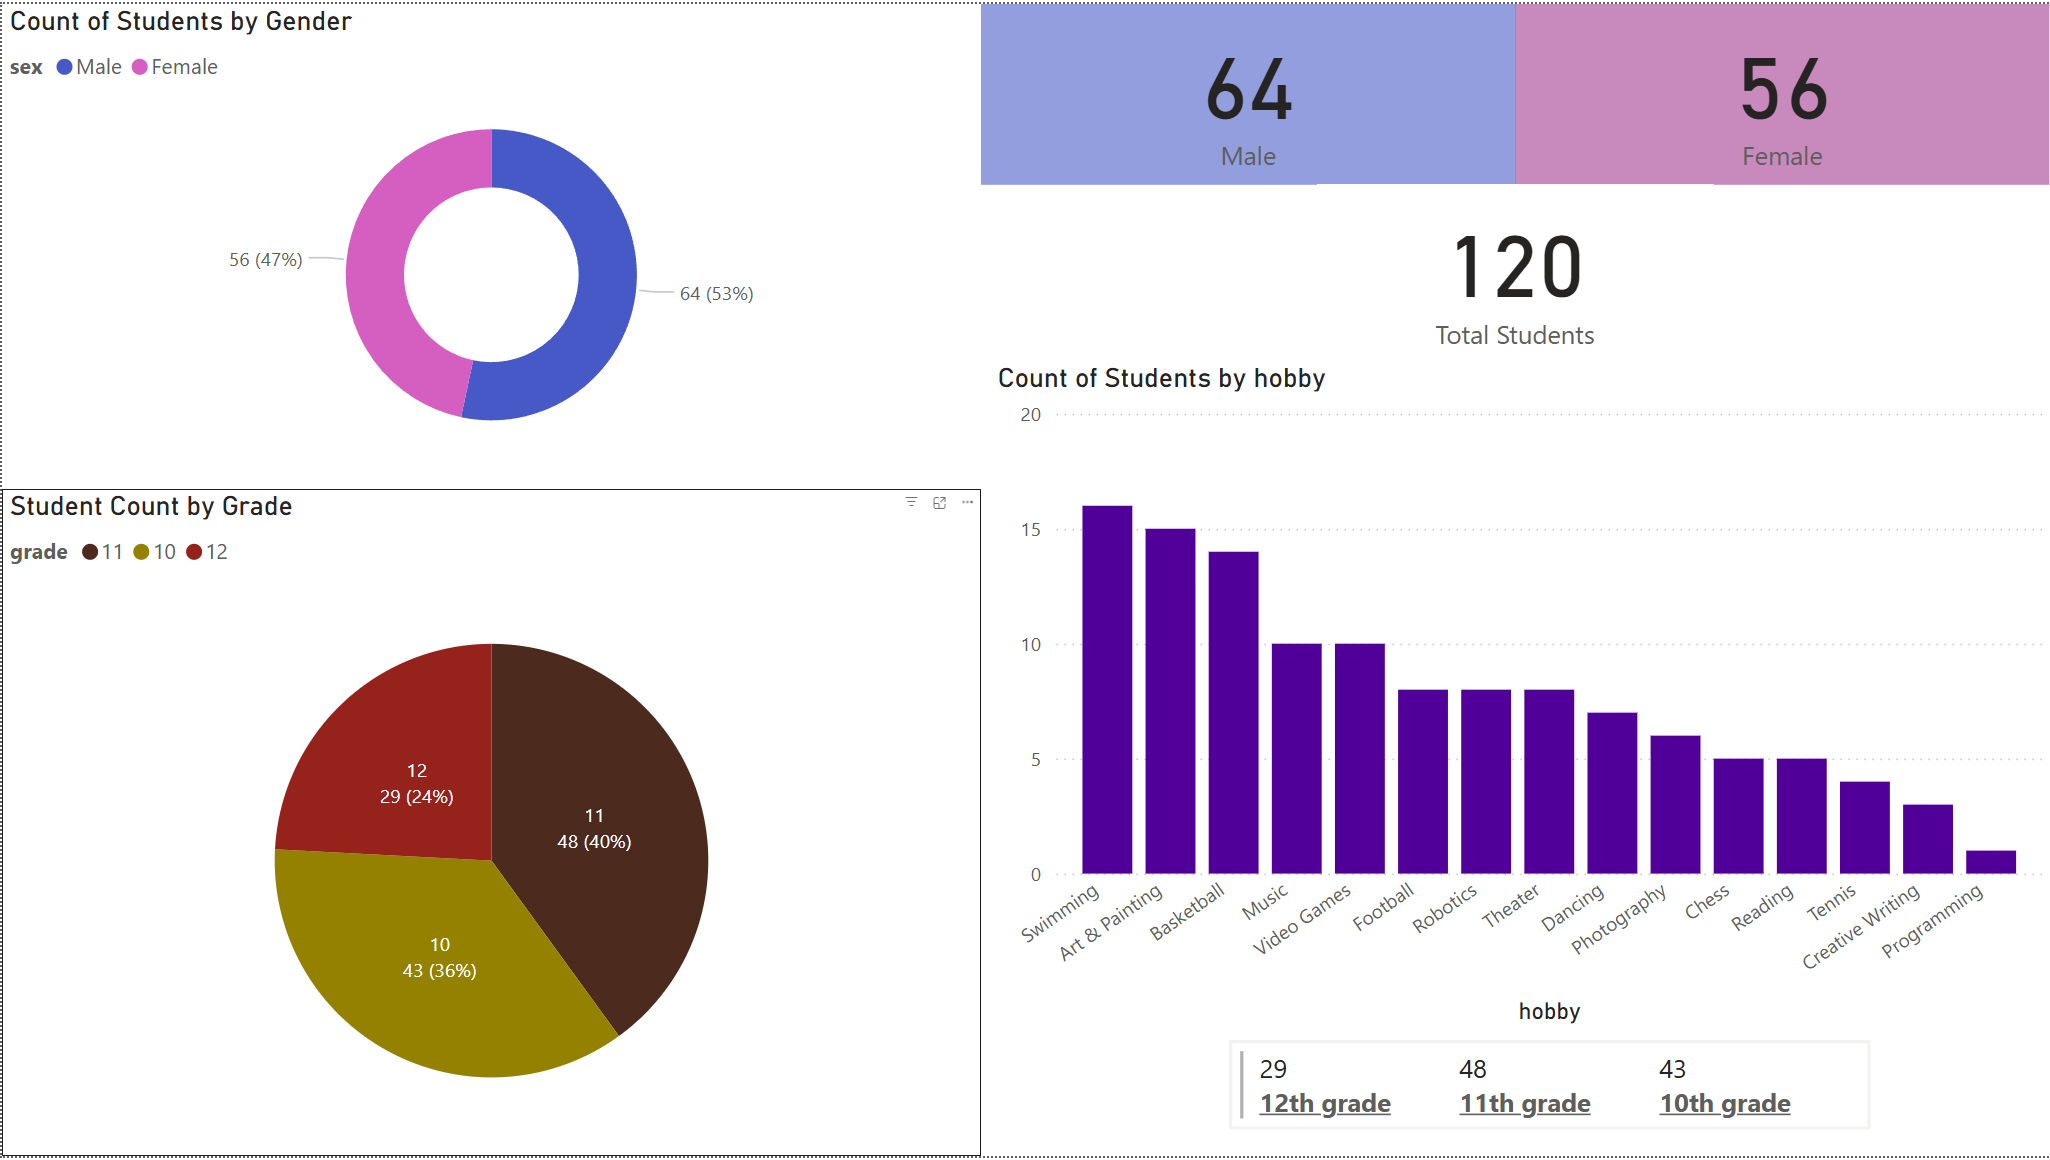
Student Report
Student gender, grades, and hobbies at a glance.
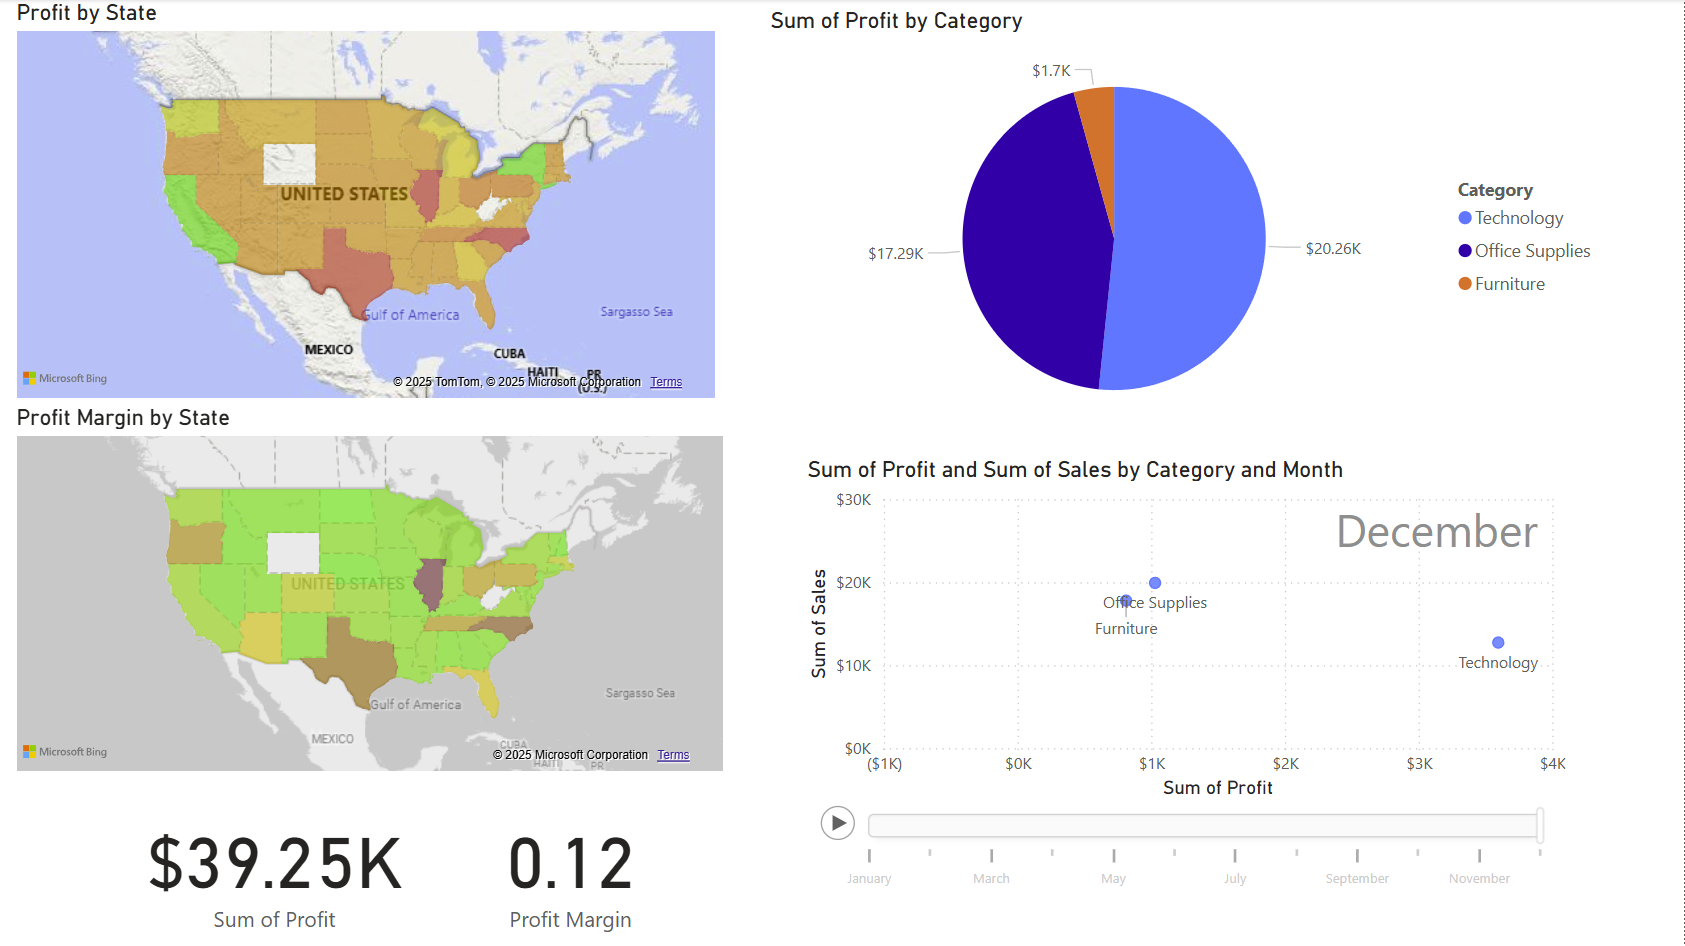
Sales & Profit Dashboard
Sales and profit margin by state, product category, and time of year.